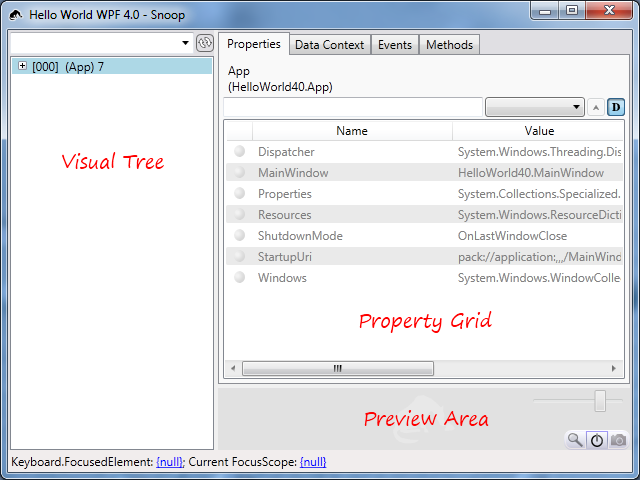
Immediately below you can see the main Snoop user interface that comes up after you Snoop an app using the App Chooser.
This is the window where you will spend most of your time while using Snoop and there is a bunch of functionality packed in here.
As you can see from my red annotations, this window has three main areas. The area on the left is the visual tree of the application and/or window that you are currently Snooping. The visual tree is currently collapsed above, but at a glance you can see that we are looking at a very simple app that only has 7 visuals total. This area is covered in detail on the Visual Tree page.
Looking to the right, you can see the property grid area. It’s a little bit of a misnomer, I guess, because this area encompasses four tabs of functionality and only two have the property grid on them, namely the Properties tab and the Data Context tab. The Properties tab shows all the properties of the currently selected visual and the Data Context tab shows all the properties for the data context of the currently selected visual. The Events tab lets you track events as they route through your application, and finally, the Methods tab allows you to invoke methods on the currently selected visual. This area is covered in detail on the Property Grid page.
Underneath the property grid, is the preview area. This area exists to show a preview of the currently selected visual, and does so, as long as you have it turned on, by toggling the button
![]() that looks like a power switch. From this area, you can also launch the Magnifier window and capture screen shots for the currently selected visual. This area is covered in detail on the
Preview Area page.
that looks like a power switch. From this area, you can also launch the Magnifier window and capture screen shots for the currently selected visual. This area is covered in detail on the
Preview Area page.
At the bottom of the window is a status bar which shows off the Keyboard.FocusedElement and the current FocusScope … again, for the currently selected visual. In fact, everything (with the exception of the Events tab) hinges off of what you have selected in the visual tree.
